OVERVIEW
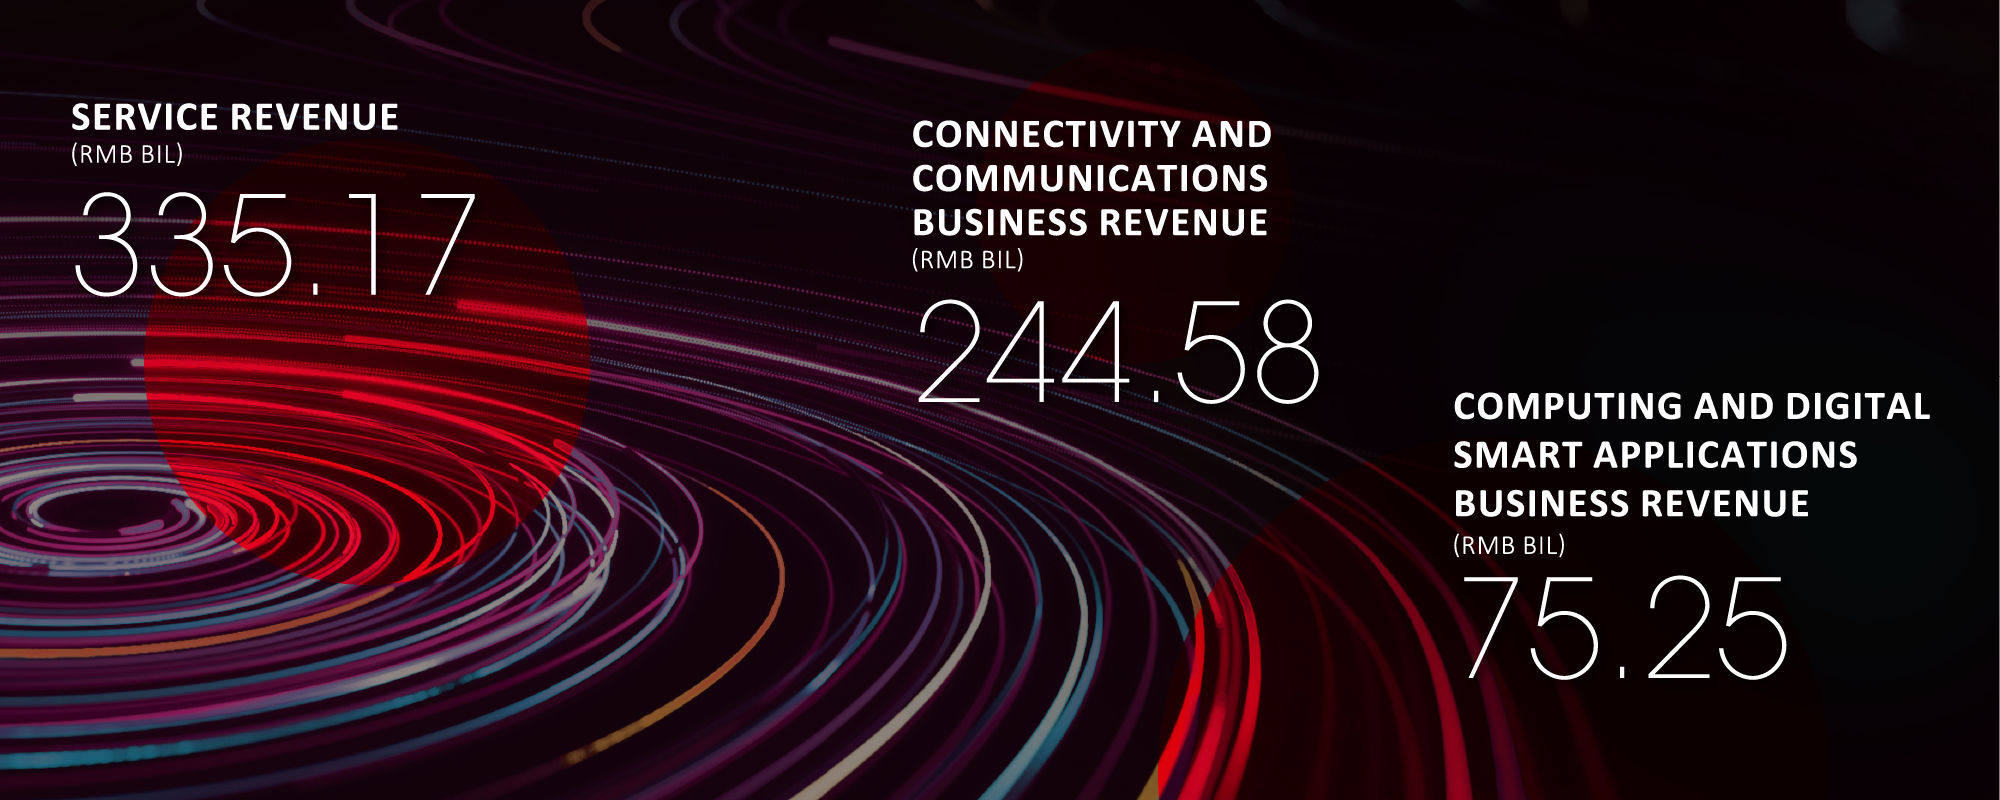
In 2023, the Company fully implemented the new development philosophies, fully assumed the two main responsibilities of building a Cyber Superpower and Digital China, and focused on the two main businesses of Connectivity and Communications and Computing and Digital Smart Applications, total revenue was RMB372.60 billion in 2023, up by 5.0% year-on-year. Service revenue reached RMB335.17 billion, up by 5.0% year-on-year. The profit attributable to equity shareholders of the Company was RMB18.73 billion, up by 11.8% year-on-year.
In 2023, the Company’s net cash flow from operating activities was RMB102.39 billion. Capital expenditure was RMB73.87 billion. Liabilities-to-assets ratio was 46.5% as at 31 December 2023.
REVENUE
In 2023, the Company’s revenue was RMB372.60 billion, up by 5.0% year-on-year, of which, service revenue was RMB335.17 billion, up by 5.0% year-on-year due to continuous optimisation of the revenue mix.
The table below sets forth the Company’s service revenue of the two main types of business for the years of 2023 and 2022:
|
2023 |
2022 |
|||
|
|
|
|||
|
(RMB in billions) |
Total |
Mix proportion |
Total |
Mix proportion |
|
|
|
|
|
|
|
Connectivity and Communications business revenue |
244.58 |
76.5% |
237.25 |
78.1% |
|
Computing and Digital Smart Applications business revenue |
75.25 |
23.5% |
66.66 |
21.9% |
|
|
|
|
|
|
Connectivity and Communications business revenue
In 2023, service revenue from Connectivity and Communications business was RMB244.58 billion, up by 3.1% year-on-year.
Computing and Digital Smart Applications business revenue
In 2023, service revenue from Computing and Digital Smart Applications business was RMB75.25 billion, up by 12.9% year-on-year.
OPERATING COSTS
In 2023, total operating costs amounted to RMB357.63 billion, up by 4.4% year-on-year.
The table below sets forth the items of the operating costs and the changes in their respective percentage of the revenue for the years of 2023 and 2022:
|
2023 |
2022 |
|||
|
|
|
|||
|
(RMB in billions) |
Total |
As a percentage |
Total |
As a percentage |
|
|
|
|
|
|
|
Operating costs |
357.63 |
96.0% |
342.60 |
96.5% |
|
Include: Interconnection charges |
11.29 |
3.0% |
10.95 |
3.1% |
|
Depreciation and amortisation |
84.85 |
22.8% |
86.83 |
24.4% |
|
Network, operation and support expenses |
60.03 |
16.1% |
56.42 |
15.9% |
|
Employee benefit expenses |
62.94 |
16.9% |
60.72 |
17.1% |
|
Include: salaries under employment contract |
41.28 |
11.1% |
40.85 |
11.5% |
|
Costs of telecommunications products sold |
36.40 |
9.8% |
34.72 |
9.8% |
|
Selling and marketing expenses |
35.83 |
9.6% |
34.46 |
9.7% |
|
Cost of Computing and Digital Smart Applications business1 |
40.08 |
10.8% |
31.79 |
9.0% |
|
General and administrative expenses2 |
5.53 |
1.5% |
5.15 |
1.5% |
|
Other operating expenses |
20.68 |
5.6% |
21.56 |
6.1% |
|
|
|
|
|
|
Interconnection charges
The interconnection charges were RMB11.29 billion in 2023, up by 3.2% year-on-year and, as a percentage of revenue, decreased from 3.1% in 2022 to 3.0% in 2023.
Depreciation and amortisation
Mainly benefiting from the Company’s good control of capital expenditure and network “co-build co-share” in recent years, depreciation and amortisation charges were RMB84.85 billion in 2023, down by 2.3% year-on-year and, as a percentage of revenue, decreased from 24.4% in 2022 to 22.8% in 2023.
Network, operation and support expenses
As the Company expanded the scale of the basic network and relevant infrastructure, network, operation and support expenses were RMB60.03 billion in 2023, up by 6.4% year-on-year and, as a percentage of revenue, increased from 15.9% in 2022 to 16.1% in 2023.
Employee benefit expenses
The Company ongoing effort in incentive mechanism reforms, strengthen performance-based compensation and optimised the human resources efficiency, employee benefit expenses were RMB62.94 billion in 2023, up by 3.6% year-on-year and, as a percentage of revenue, decreased from 17.1% in 2022 to 16.9% in 2023.
Cost of telecommunications products sold
Costs of telecommunications products sold were RMB36.40 billion and revenue from sales of telecommunications products were RMB37.43 billion in 2023. Gross profits on sales of telecommunications products was RMB1.03 billion.
Selling and marketing expenses
The Company appropriately increased selling and marketing expenses to enhance market attractiveness, selling and marketing expenses were RMB35.83 billion in 2023, up by 4.0% year-on-year and, as a percentage of revenue, decreased from 9.7% in 2022 to 9.6% in 2023.
Cost of Computing and Digital Smart Applications business1
The Company seized the growth opportunities of the digital economy and continued to develop the Computing and Digital Smart Applications business, cost of Computing and Digital Smart Applications business were RMB40.08 billion in 2023, up by 26.1% year-on-year and, as a percentage of revenue, increased from 9.0% in 2022 to 10.8% in 2023.
General and administrative expenses2
General and administrative expenses were RMB5.53 billion in 2023, up by 7.3% year-on-year and, as a percentage of revenue was basically the same as 1.5%.
Other operating expenses
Other operating expenses were RMB20.68 billion in 2023, down by 4.1% year-on-year and, as a percentage of revenue, decreased from 6.1% in 2022 to 5.6% in 2023.
EARNINGS
|
2023 |
2022 |
||
|
|
|
|
|
|
(RMB in billions) |
Total |
Total |
Change |
|
|
|
|
|
|
Operating profits |
14.97 |
12.34 |
21.3% |
|
Net interest income |
0.12 |
0.66 |
–80.9% |
|
Share of net profit of associates |
2.52 |
2.15 |
17.0% |
|
Share of net profit of joint ventures |
1.80 |
1.59 |
13.2% |
|
Other income-net |
3.53 |
3.85 |
–8.2% |
|
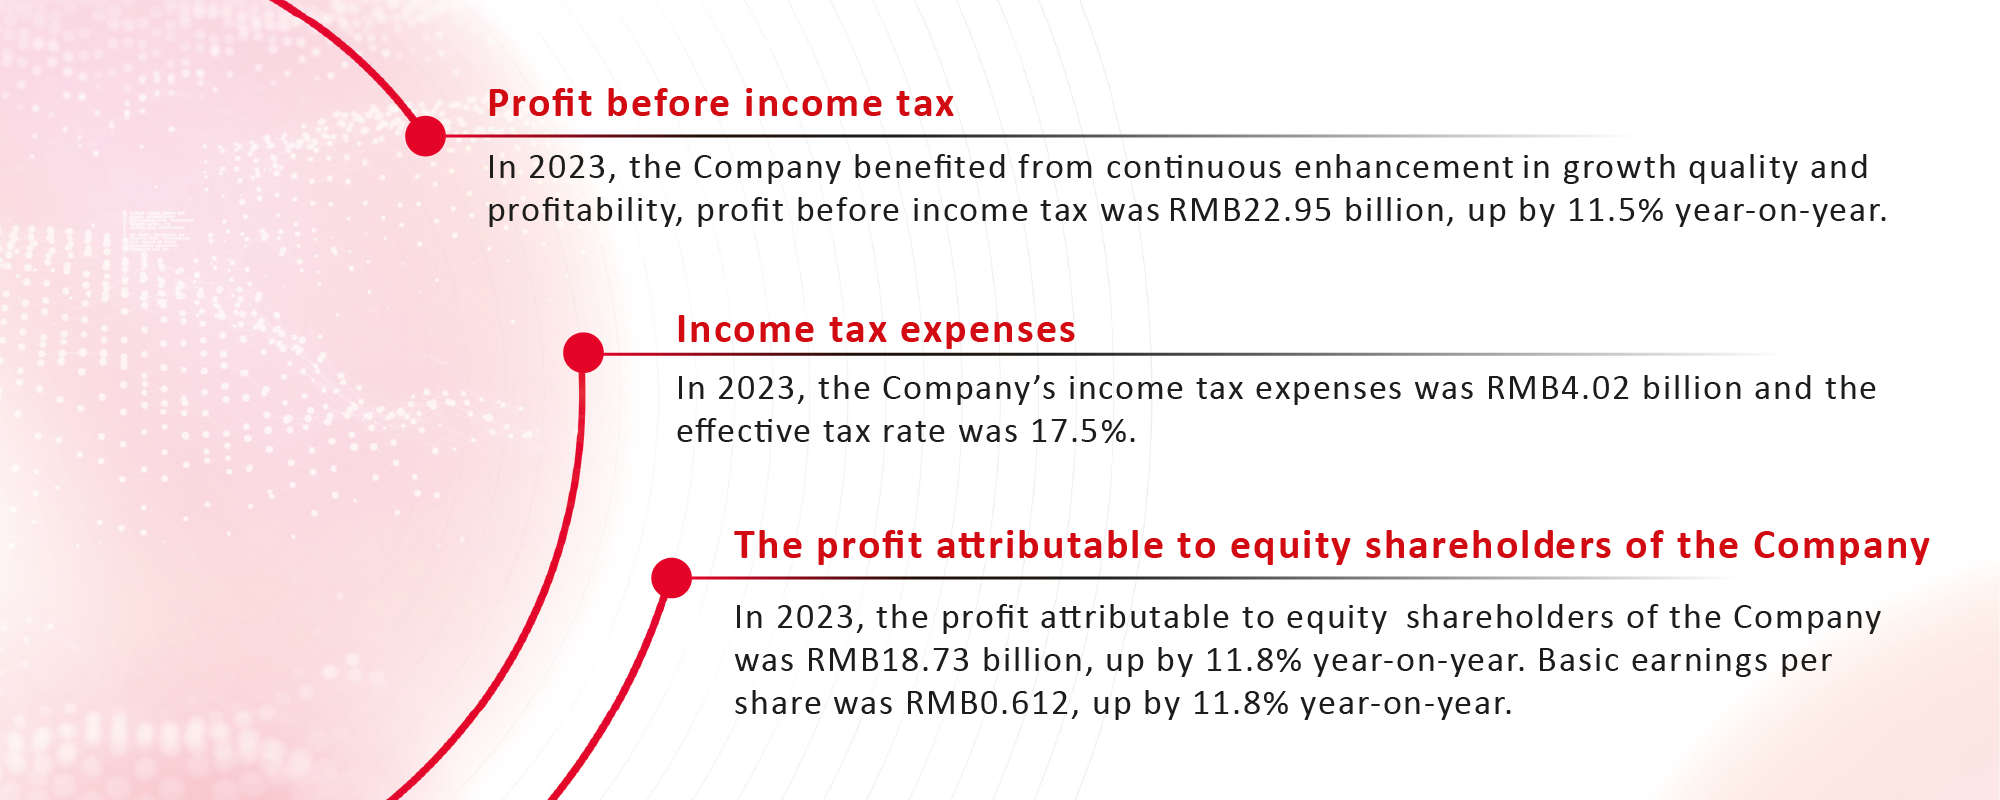
Profit before income tax |
22.95 |
20.59 |
11.5% |
|
Income tax expenses |
4.02 |
3.75 |
7.3% |
|
Profit for the year |
18.92 |
16.84 |
12.4% |
|
Include: the profit attributable to equity shareholders of the Company |
18.73 |
16.74 |
11.8% |
|
|
|
|
|
EBITDA3
In 2023, the Company’s EBITDA was RMB99.81 billion, up by 0.6% year-on-year. EBITDA as a percentage of service revenue was 29.8%, down by 1.3 percentage points year-on-year, and the decline of EBITDA as a percentage of service revenue narrowed by 0.1 percentage point year-on-year.
CAPITAL EXPENDITURE AND CASH FLOW
In 2023, capital expenditure of the Company totaled RMB73.87 billion. Investments focus on the main responsibilities and businesses; the scale of investment matches the business growth and cash position.
In 2023, the Company’s net cash flow from operating activities was RMB102.39 billion. Free cash flow4 was RMB28.52 billion after the deduction of the capital expenditure.
BALANCE SHEET
The Company’s total assets increased from RMB642.66 billion as at 31 December 2022 to RMB661.05 billion as at 31 December 2023. Total liabilities increased from RMB299.13 billion as at 31 December 2022 to RMB307.15 billion as at 31 December 2023. The liabilities-to-assets ratio was 46.5% as at 31 December 2023, basically the same as last year. The debt-to-capitalisation ratio decreased from 14.3% as at 31 December 2022 to 11.6% as at 31 December 2023. The net debt-to-capitalisation ratio was –0.3% as at 31 December 2023.
Note 1: Cost of Computing and Digital Smart Applications business excludes the cost of data centre business.
Note 2: General and administrative expenses excludes staff costs and depreciation.
Note 3: EBITDA represents profit for the year before finance costs, interest income, shares of net profit of associates, share of net profit of joint ventures, other income-net, income tax expense, depreciation and amortisation. As the telecommunications business is a capital intensive industry, capital expenditure and finance costs may have a significant impact on the net profit of the companies with similar operating results. Therefore, the Company believes that EBITDA may be helpful in analysing the operating results of a telecommunications service operator like the Company. However, it is a non-GAAP financial measure which does not have a standardised meaning and therefore may not be comparable to similar measures presented by other companies.
Note 4: Free cash flow represents operating cash flow less capital expenditure. However, it is a non-GAAP financial measure which does not have a standardised meaning and therefore may not be comparable to similar measures presented by other companies.
Note 5: Connectivity and Communications business revenue is the sum of relevant amounts in various types of service revenue, including voice usage and monthly fees RMB21.21 billion, broadband and mobile data services RMB154.75 billion, data and internet application services RMB14.39 billion, other value-added services RMB29.19 billion, transmission lines usage and associated services RMB22.67 billion and other services RMB2.37 billion.
Computing and Digital Smart Applications business revenue consists of service revenue related to data and internet application services RMB75.25 billion.
In addition to the above two business revenue, other business service revenue was RMB15.34 billion. Details of the disaggregation of service revenue, please refer to Note 6 of the consolidated financial statements.